User Interface
Dendra’s user interface was designed by environmental researchers and scientists in order to optimize its use for every aspect of research, monitoring, and asset management.
Data Exploration
Section titled “Data Exploration”Both field technicians and researchers have the same need to explore the data, dig into metadata, and download. Searching and retrieving data can be done through a modern single-page web application or through the API.
The web app uses faceted search to allow data exploration for a user with live graphing of data prior to downloading (Figures 1 and 2). Modelers and Jupyter Notebook users can access data via the API, performing analyses without ever having to download data locally.
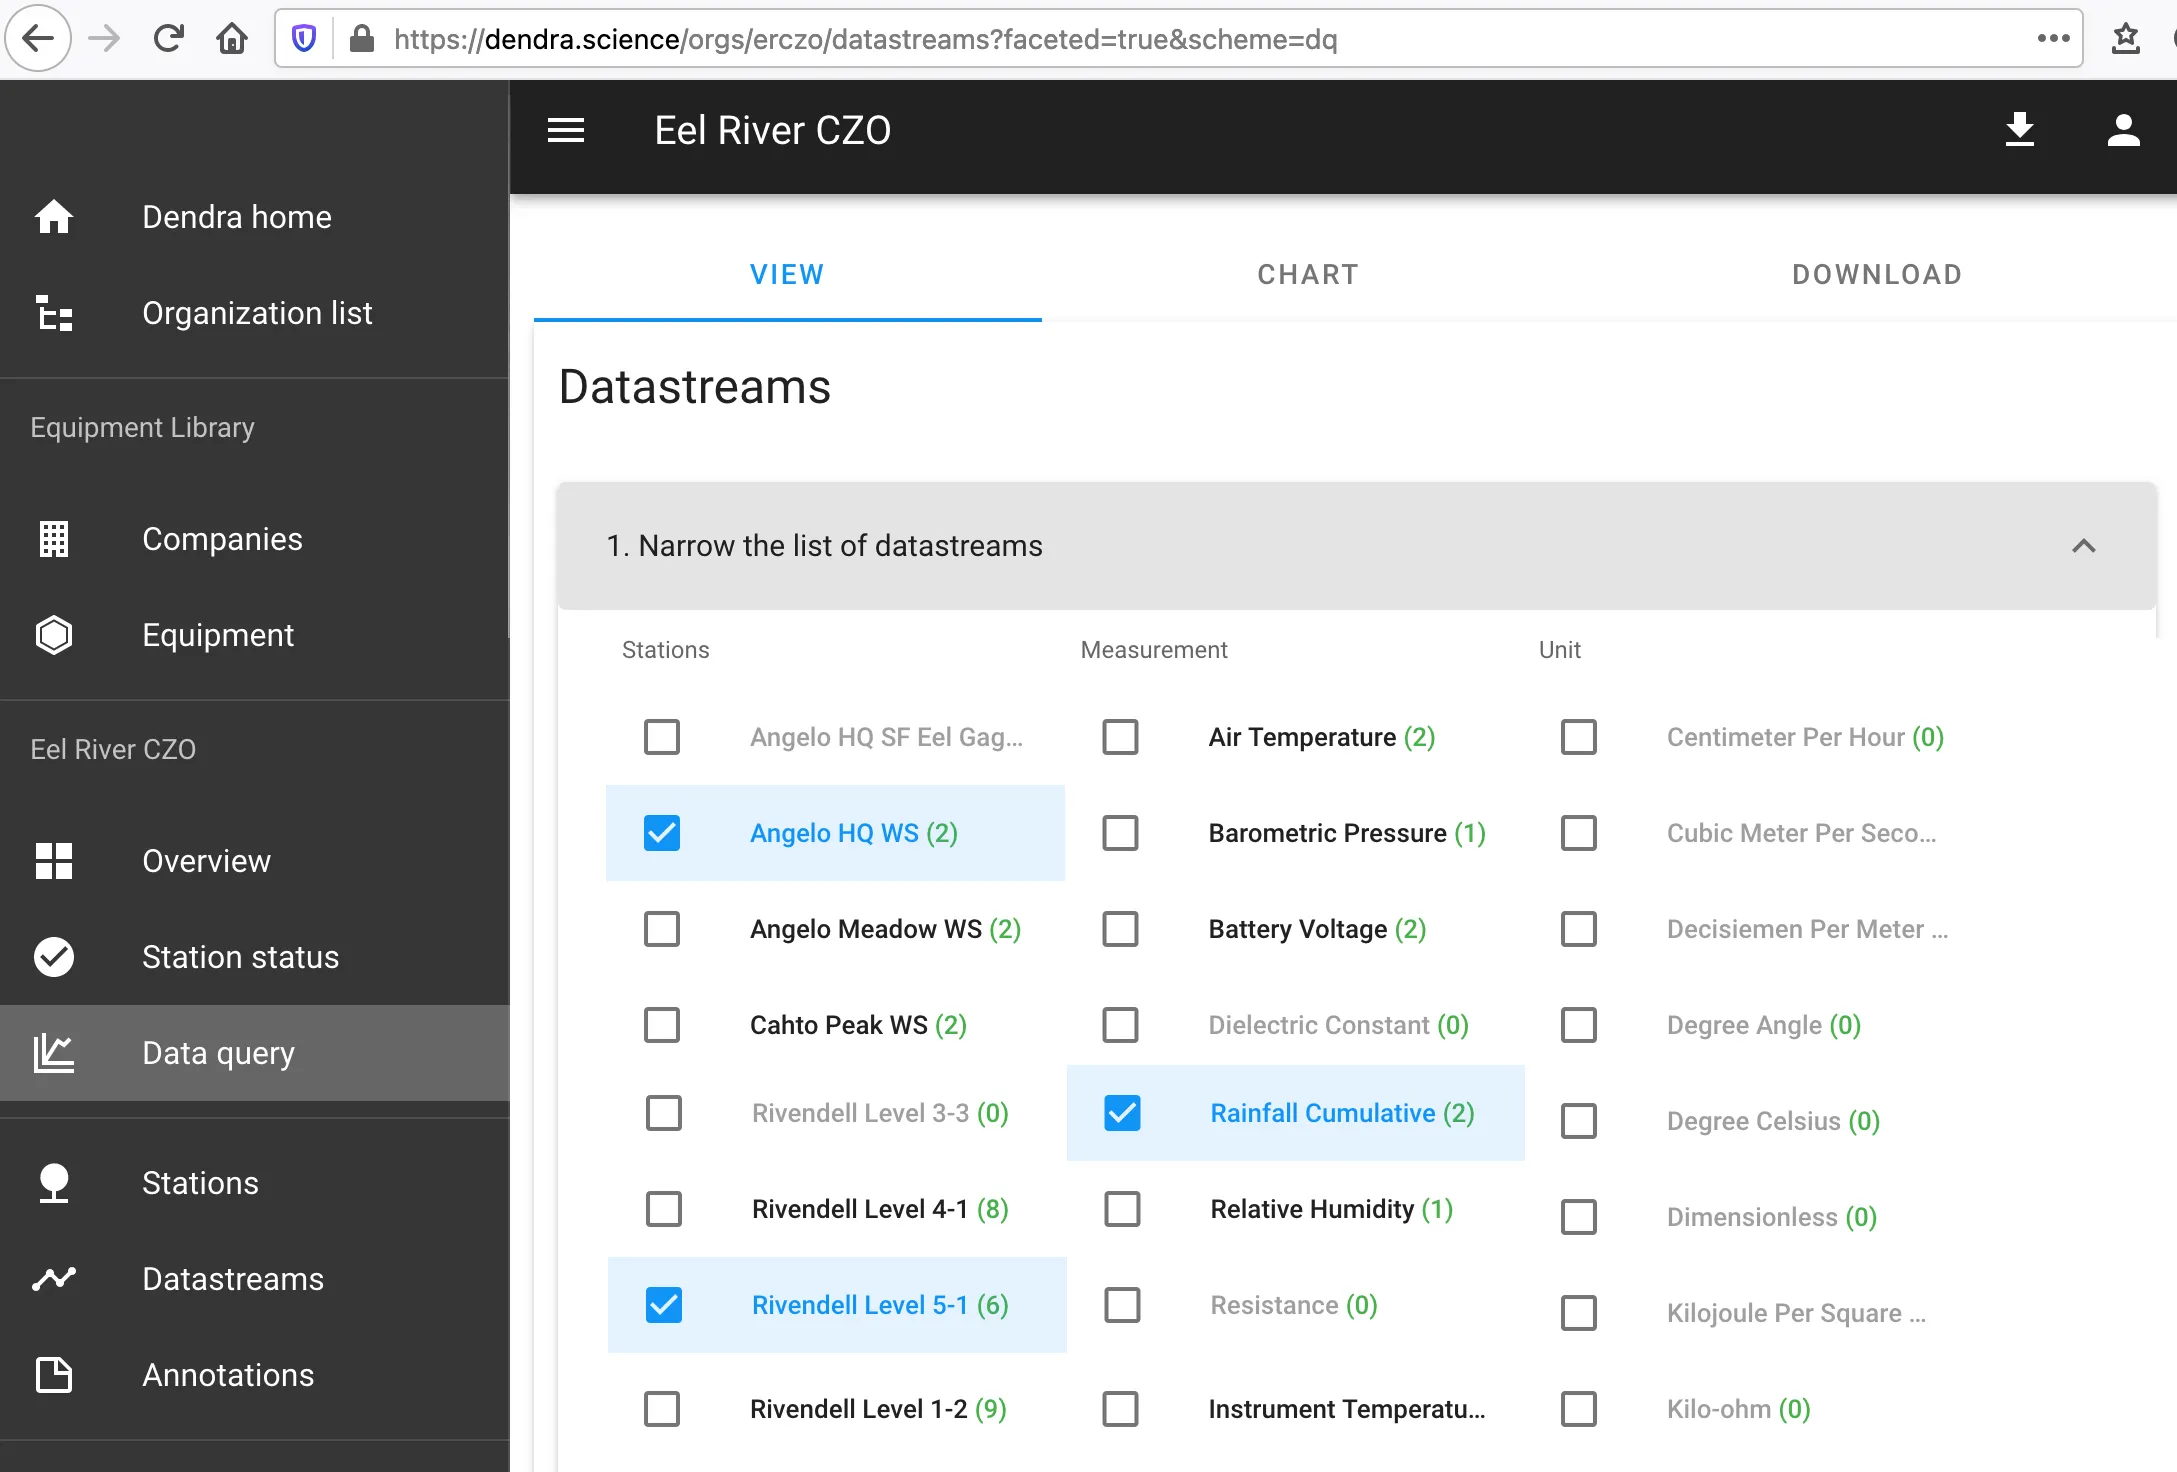 Figure 1: Dendra Search Interface
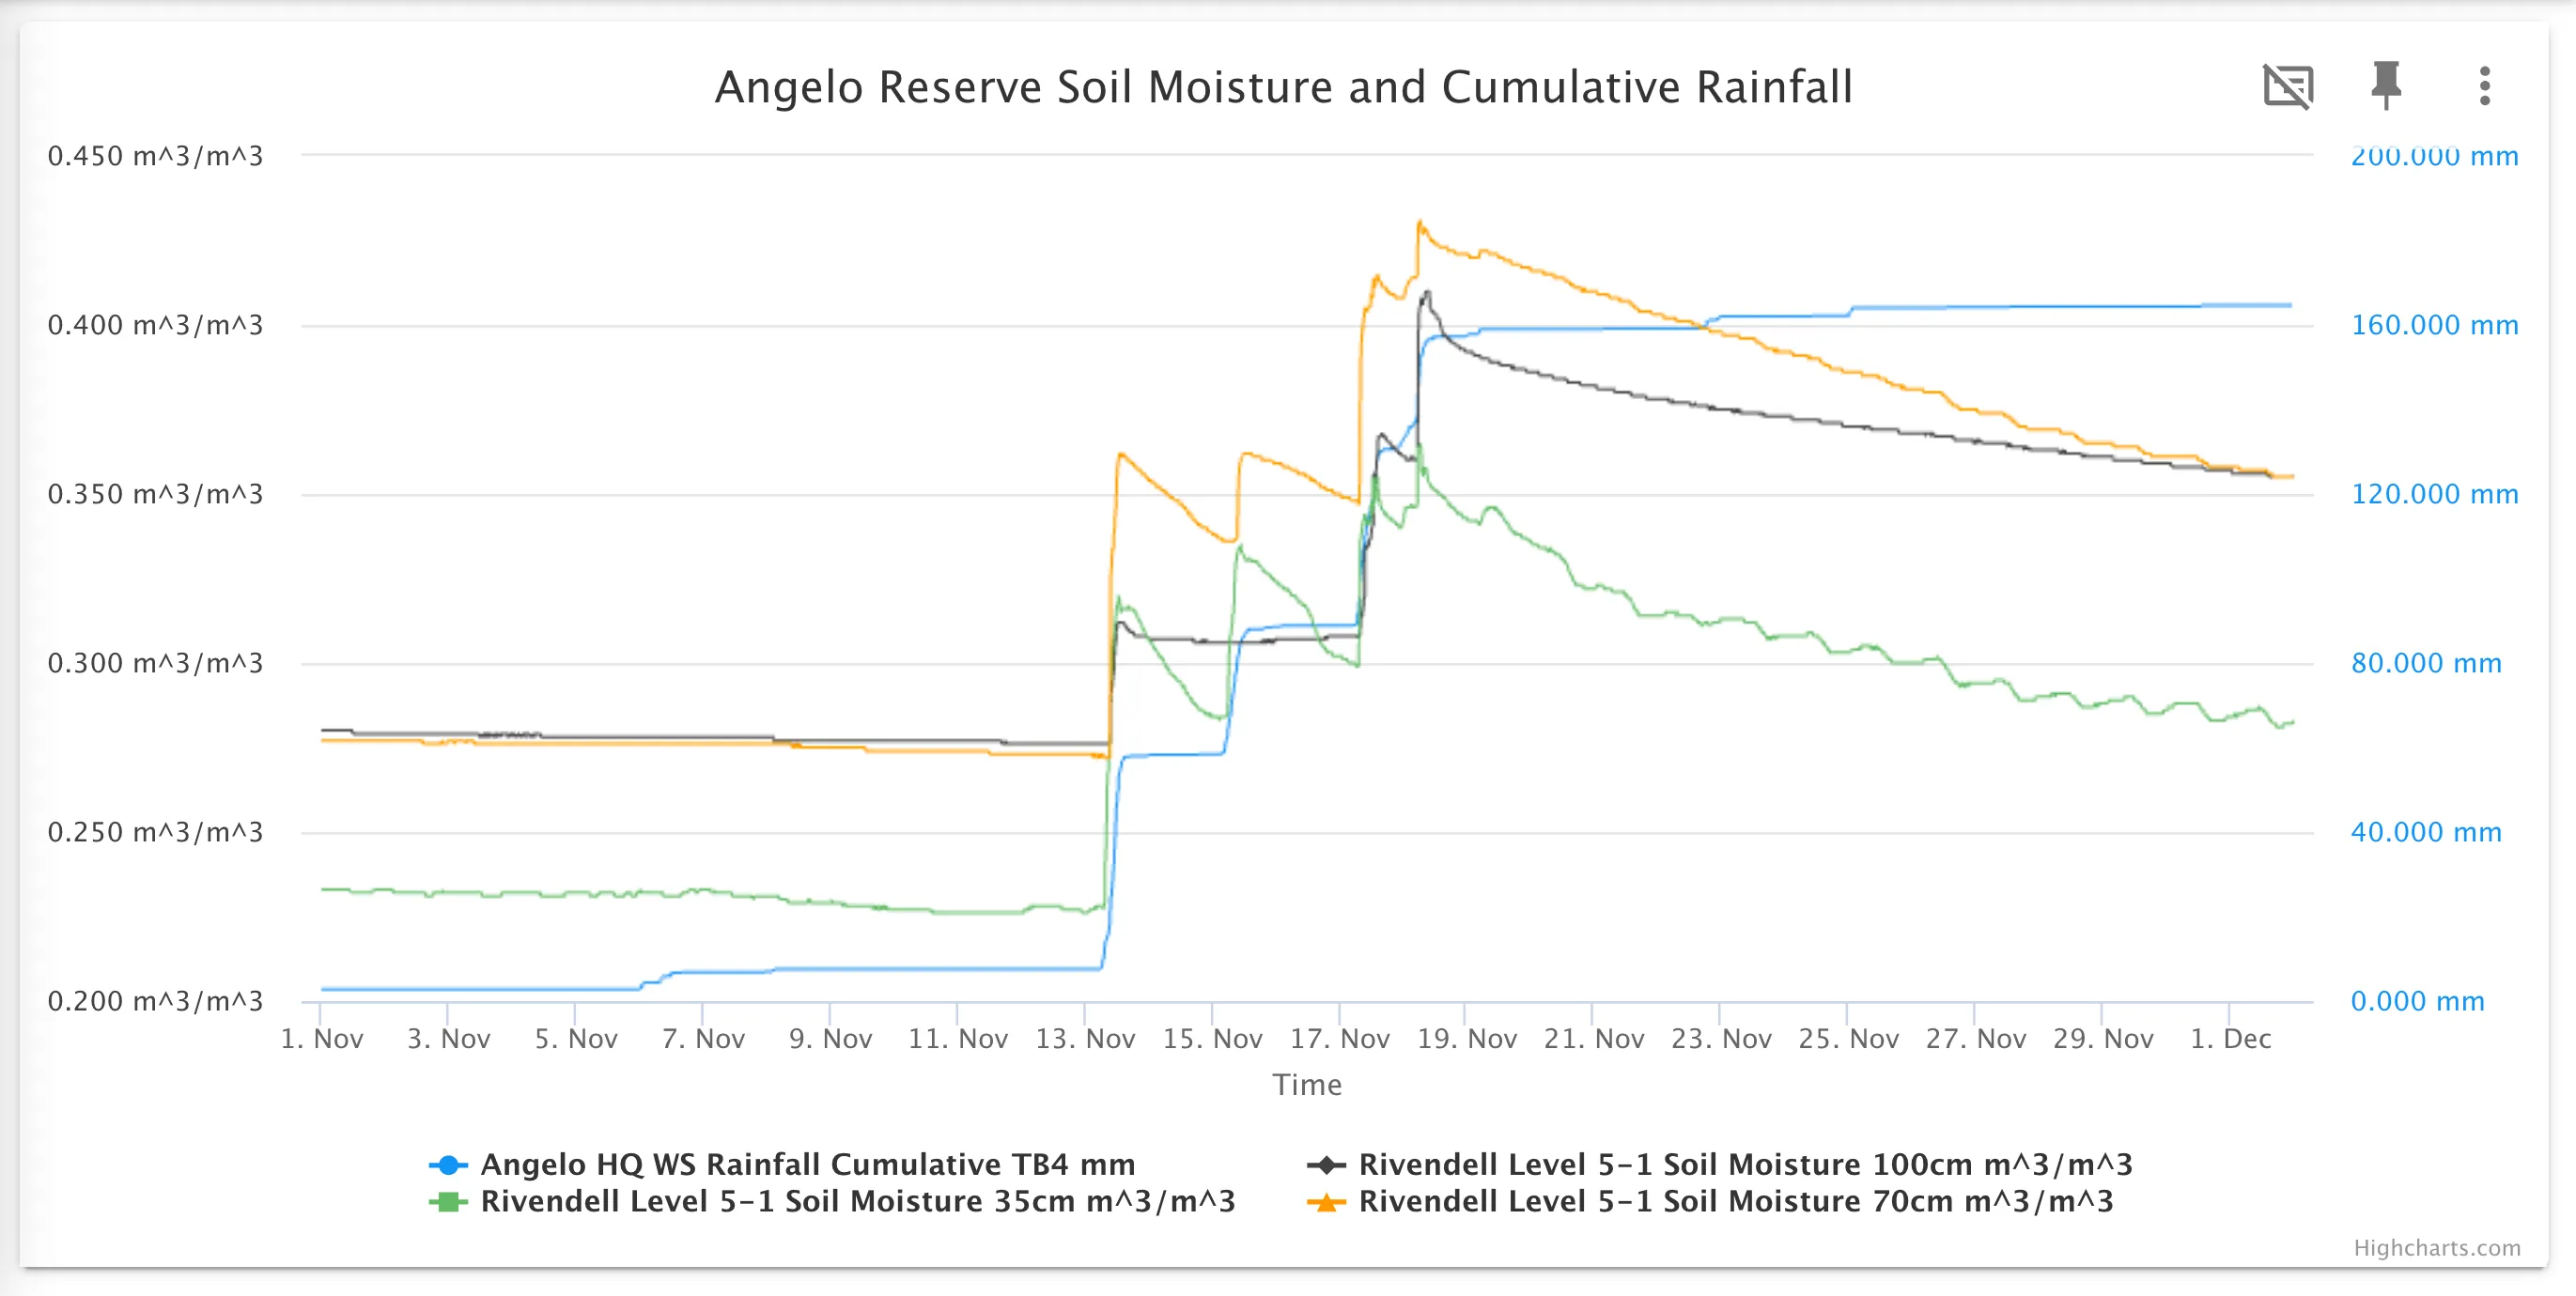 Figure 2: Dendra Graphing Interface
Interface Design
Section titled “Interface Design”The user experience evolved through many iterations with the members of the ERCZO and later UCNRS & CHI-FW projects. The first versions of the search interface made little sense to the scientists.
After changing controlled vocabulary to better match common usage and adding in faceted search to make discovery and plotting of measurements across dataloggers, Dendra’s UX has evolved into a tool that emphasizes getting the user to a measurement they care about at a time and place.
Troubleshooting
Section titled “Troubleshooting”While Dendra prioritizes simple, streamlined data exploration, the management aspect of Dendra captures and has available all the details regarding that measurement that will be important for the analysis and troubleshooting of the data. This can include
- The make and model of the sensor
- If it changed models
- If fieldnames changed in the logger
- When the last calibration was performed
And more.
See How to Explore Data to learn more.