Data Explorer
Release 2 is organized around one organization at a time. The new Data Explorer starts from the map instead. You can search every organization you are allowed to see at once, narrow by measurement, then pick datastreams to chart.
Quick Start
Section titled “Quick Start”This is the short version of how to find datastreams and chart them.
- Open
Explore. - Narrow the search with
Organizations,Groups, andMeasurements. - Pan and zoom the map until sites appear (see Datastreams appear when you zoom in).
- Scroll to the
Datastreamstable. - Choose
Add to Cart, then pick fields. - Hit
Chart.
Open the Explorer
Section titled “Open the Explorer”From the Start Page, choose the Cross-organization Data Explorer (New) card, or choose Explore in the top bar.
You can use the Explorer without logging in and see public organizations. If you log in, you also get:
- A
My Orgstoggle to list only the organizations you belong to. - Exact site locations for your own organizations. See A Note on Locations.
- Datastreams that are visible to members only.
- The
Feedbackbutton.
The Download and Status links in the top bar are not active in this version.
Page Areas
Section titled “Page Areas”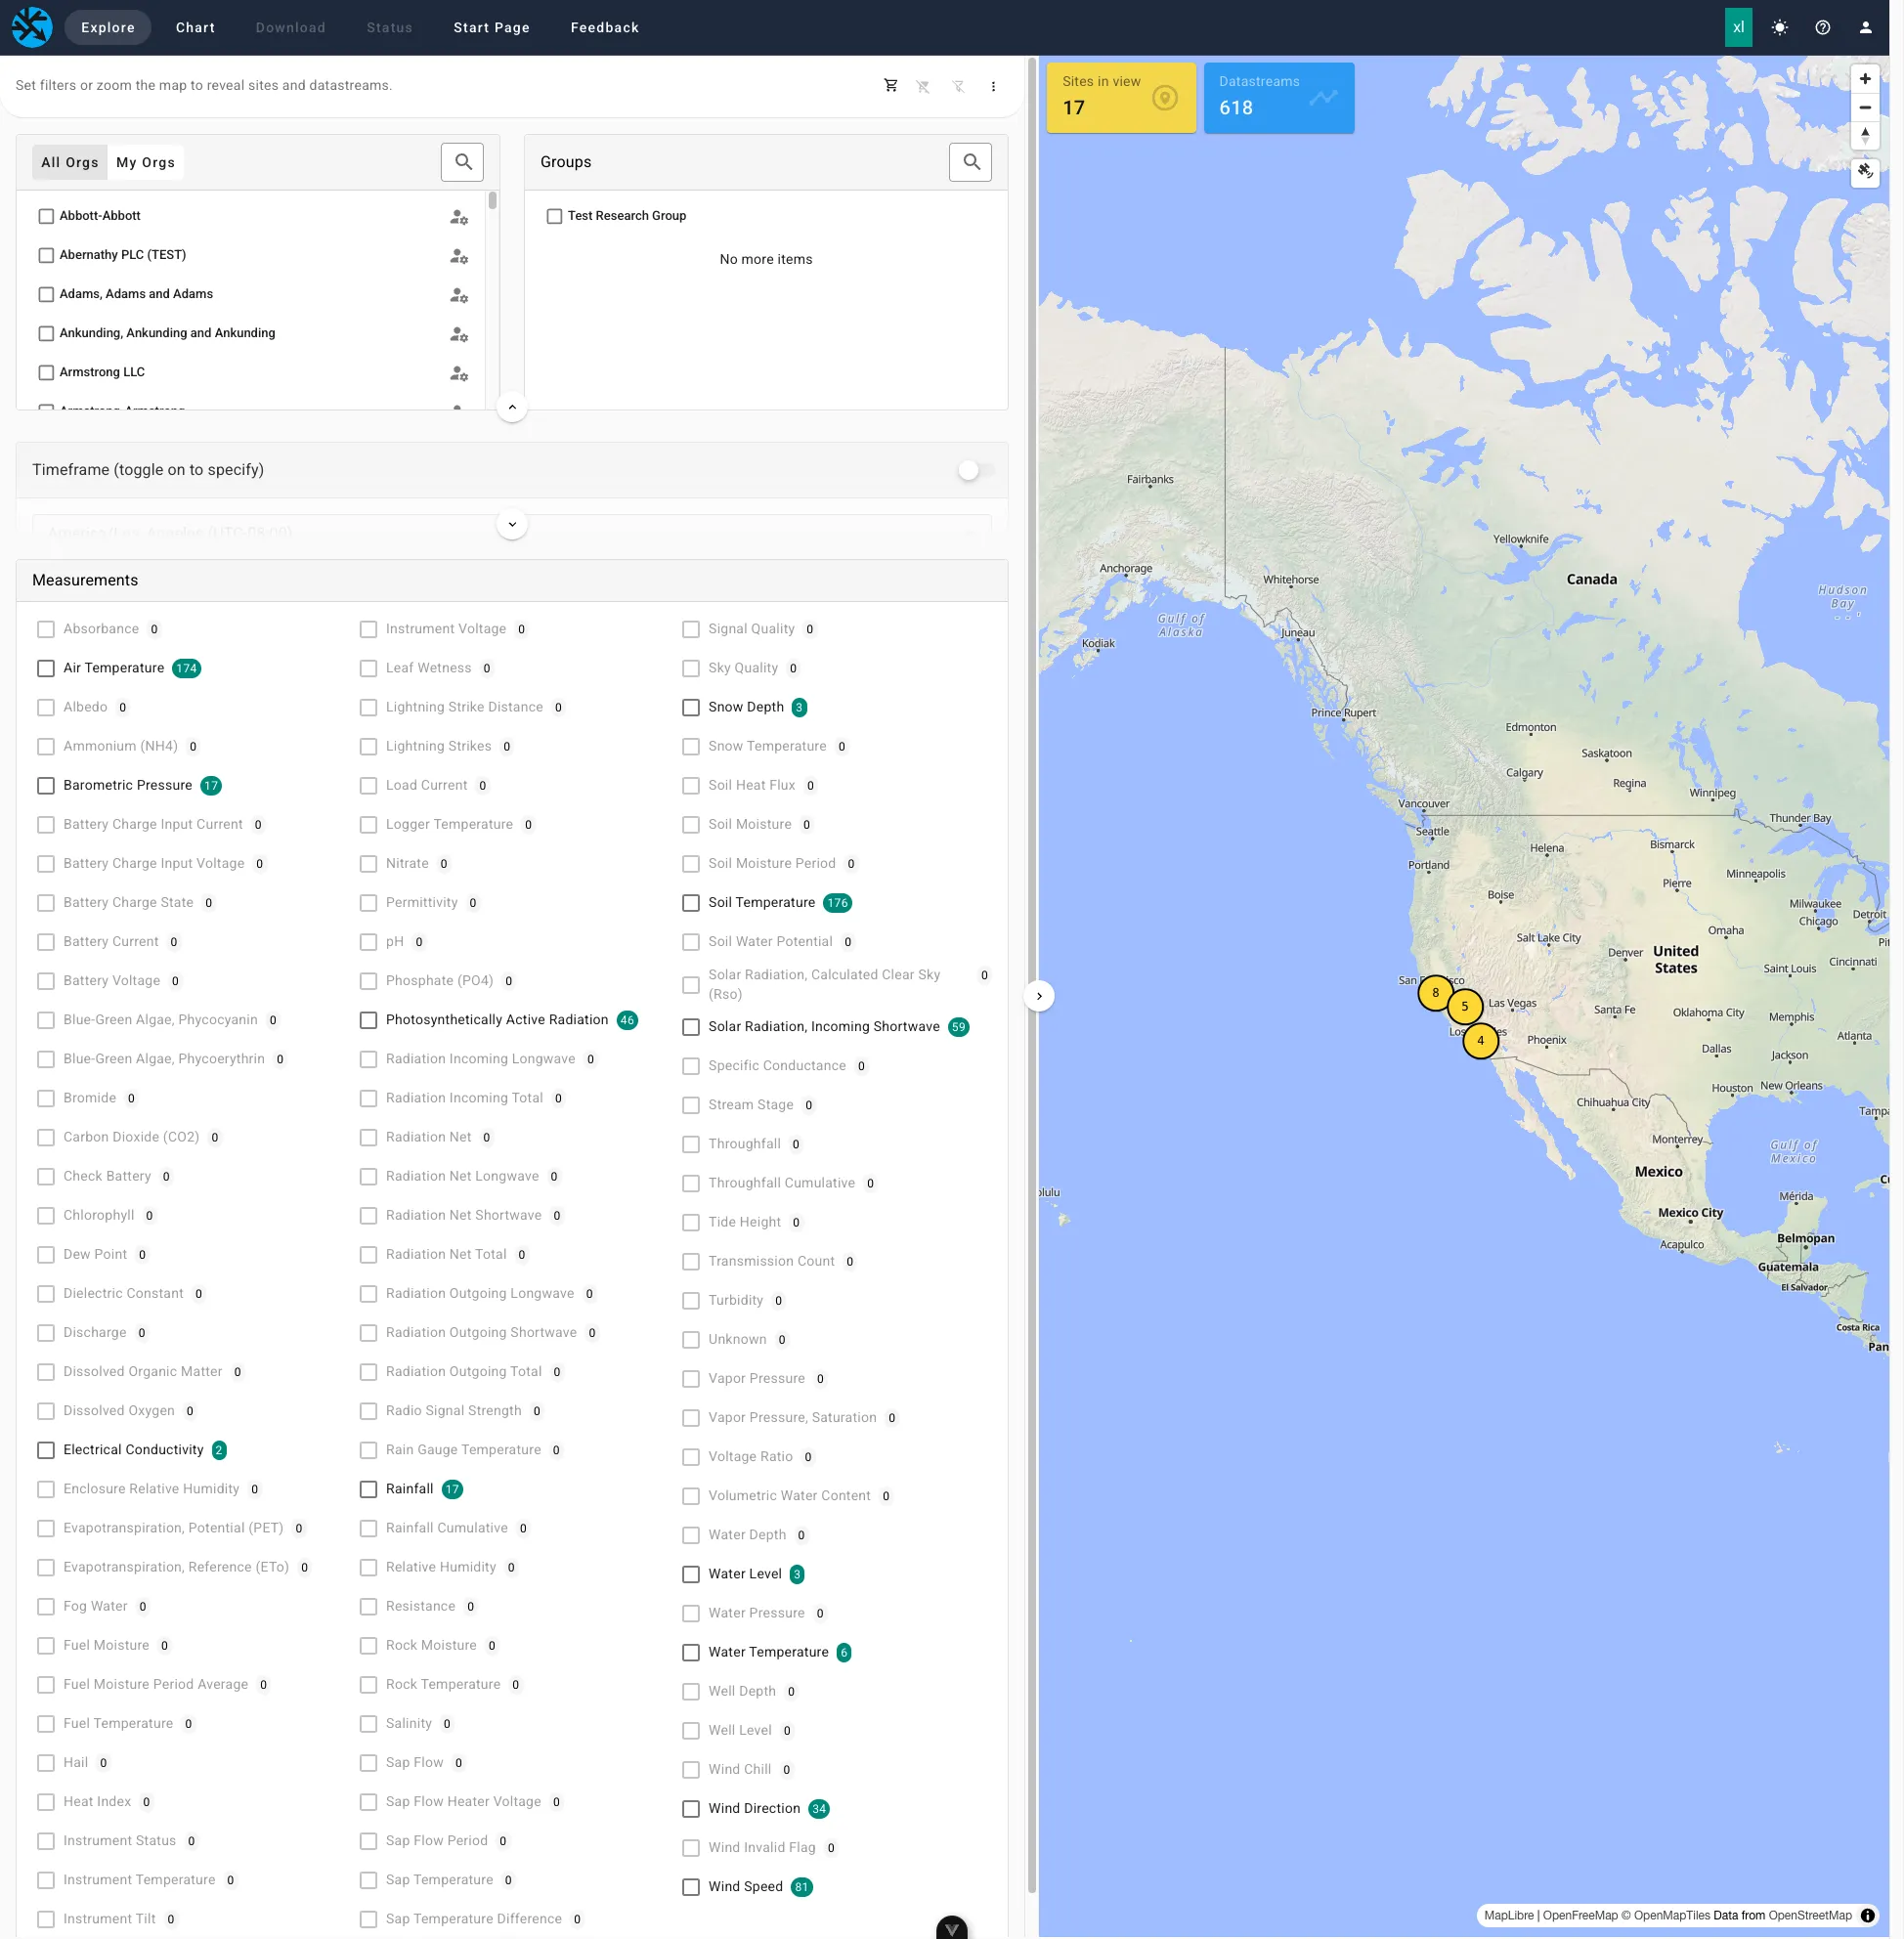
Top bar. Links to Explore, Chart, and Start Page. When you are logged in, there is also a Feedback button.
Map (right). Yellow markers show where sites are. Numbered circles are clusters of several sites. The map has:
- Zoom and compass controls.
- A satellite button that switches between the street map and satellite imagery.
- Two counters,
Sites in viewandDatastreams, that show what the current filters match inside the map.
Panel (left). Everything that filters the map, from top to bottom:
| Section | What it does |
|---|---|
| Status bar | A prompt or the View Datastreams button. On the right: the cart count, Clear cart, Clear selections, and an options menu. |
| Organizations | Check the organizations to include. All Orgs or My Orgs when logged in. Has a text filter. |
| Groups | Check groups to include. Has a text filter. |
| Timeframe | Optional date range. Off by default. |
| Measurements | Check the kinds of observation to include, such as Air Temperature. Counts show how many datastreams match each one. |
| Sites | Appears once sites are shown. Check sites to focus on. |
| Datastreams | Appears once sites are shown. Lists the matching datastreams with a text filter and the Add to Cart and Chart buttons. |
The small arrow buttons below each section collapse or expand it. The arrow on the border between the panel and the map makes the panel wider.
How to Use It
Section titled “How to Use It”-
Pick organizations and groups
Section titled “Pick organizations and groups”Check the organizations you care about. Leaving a list unchecked means all of them, the same as in the classic interface. Organizations and groups narrow each other. See Reading the Filters.
Use
My Orgsto show only organizations you belong to, thenSelect Allto check them. -
Choose a timeframe (optional)
Section titled “Choose a timeframe (optional)”Turn on the
Timeframeswitch, then pick a begin date and, optionally, an end date. Dates use the timezone shown beside the picker.With
Timeframeoff, the Explorer shows datastreams where they are deployed now. With it on, you find datastreams that were deployed at any time in the range, including at sites they have since left. -
Choose measurements
Section titled “Choose measurements”Check one or more
Measurements. Checking more than one shows datastreams that match any of them. Counts update as you change other filters.Under the three dots in the status bar,
Purposecontrols which kinds of data are listed. It starts atReady to Use. See Purpose. -
Pan and zoom the map
Section titled “Pan and zoom the map”Drag to pan. Scroll or use the
+and-buttons to zoom. Click a numbered cluster to zoom in on it. -
Select sites (optional)
Section titled “Select sites (optional)”Hover over or click a site marker, then use the checkbox in the popup. You can also check sites in the
Siteslist. Selected sites turn a darker yellow. This keeps nearby sites on the map so you can pick several. -
Review the datastreams
Section titled “Review the datastreams”Choose
View Datastreamsin the status bar, or scroll down. Use the search box in the table header to filter by name or field.
Datastreams Appear When You Zoom In
Section titled “Datastreams Appear When You Zoom In”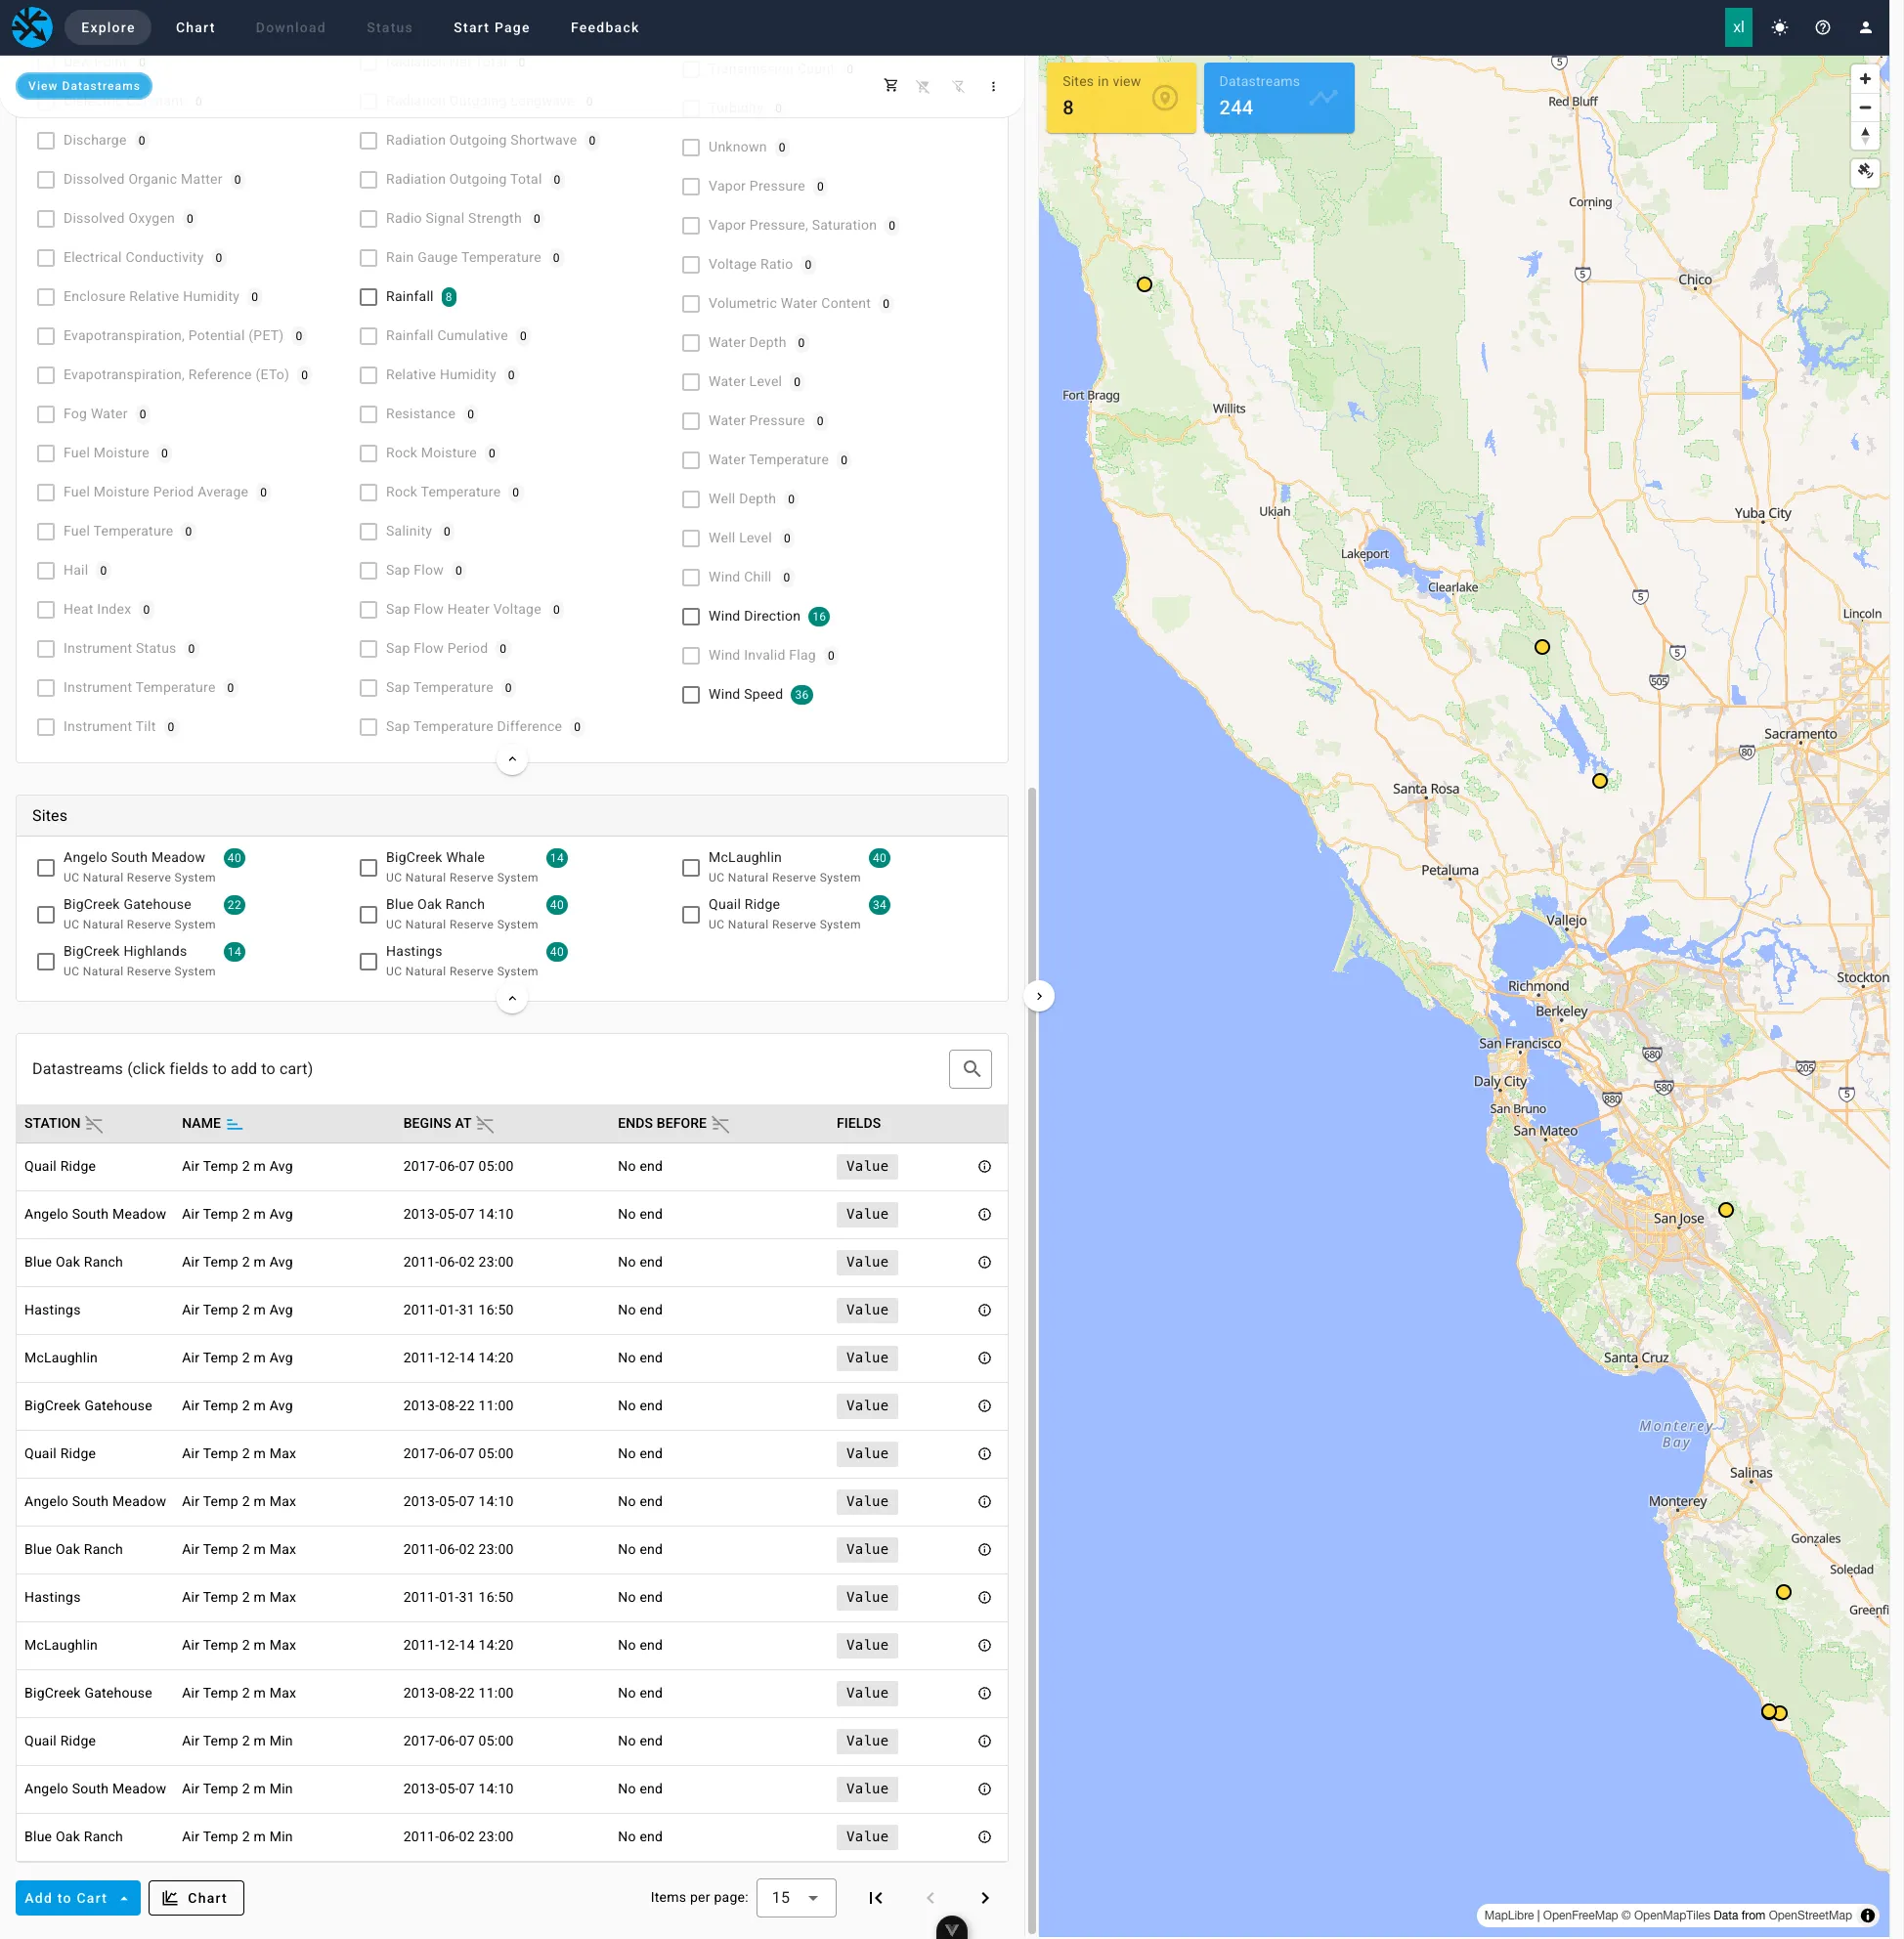
This keeps the page fast and the map readable. The status bar says Set filters or zoom the map to reveal sites and datastreams. until sites are shown. If you pick an organization or group, the map does not move for you, so zoom to where its sites are.
Reading the Filters
Section titled “Reading the Filters”- Counts beside
MeasurementsandSitesshow how many datastreams match. A count of0means that choice has nothing under your other filters, but the choice stays listed. - Choosing something in
OrganizationsnarrowsGroupsto the groups those organizations use, and the other way around. - A greyed row is still checked, so it still filters, but it no longer fits your other selections. Uncheck it to remove it.
Clear selectionsunchecks everything and turns off the timeframe.
The cart works like a shopping cart. You collect output fields from many datastreams, possibly from several organizations, then chart them together.
- In the
Datastreamstable, chooseAdd to Cart. - Click a field name to add that field for every datastream on the current page, or choose
Add All Shown. - Fields already in the cart are highlighted.
- Choose
Chartto open the Chart page with your cart.
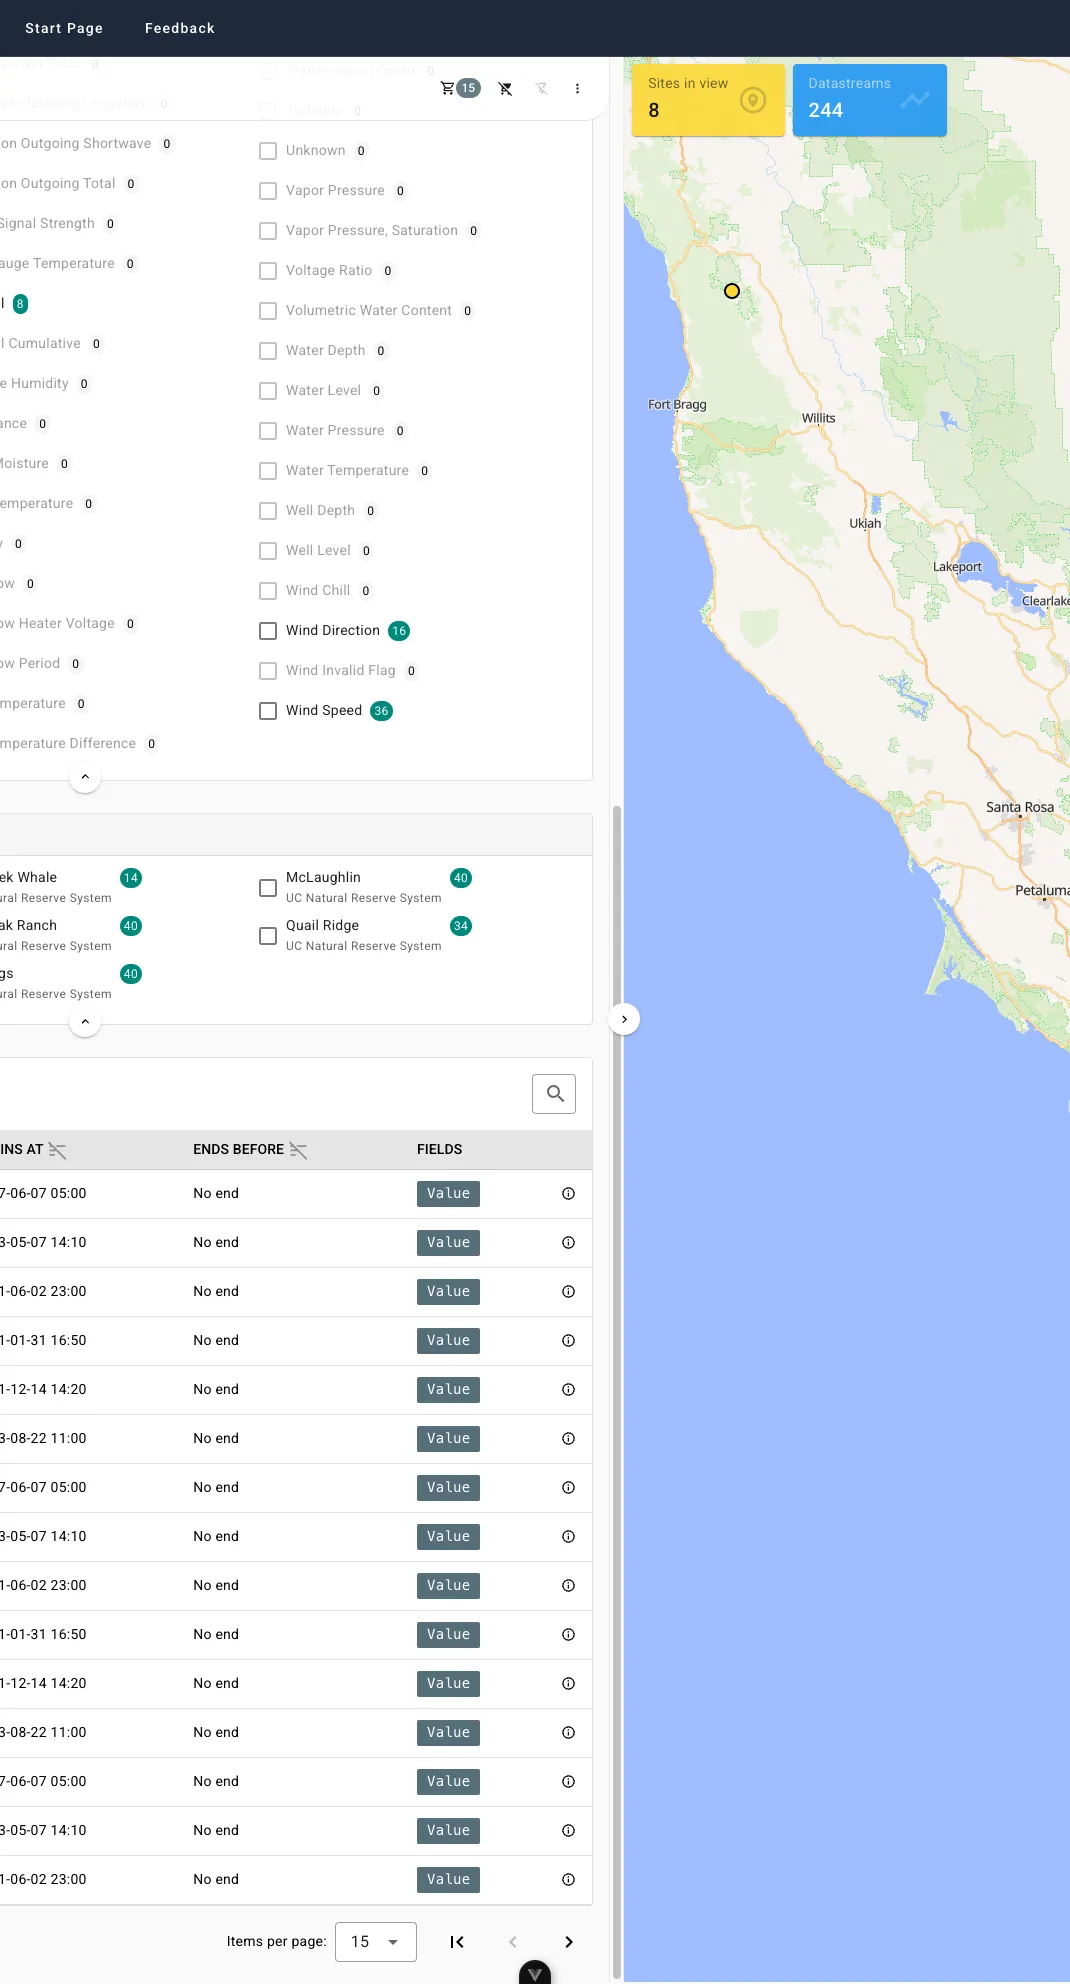
The number next to the cart icon in the status bar is how many fields you have collected. Clear cart empties it.
Your cart and filters stay put while you pan the map or move between Explore and Chart. They are not saved, so refreshing or closing the tab clears them.
Chart and Download Access
Section titled “Chart and Download Access”Seeing a datastream in the Explorer does not mean you can chart or download its data. Each organization sets an access level for the public and another for its members. The levels that matter once a datastream is in your cart are:
| Your access | What you get |
|---|---|
Chart | The chart draws a reduced set of points. Export CSV saves that same reduced set. |
Download | The chart draws every recorded reading. Export CSV saves every reading. |
If you have neither, the chart shows No chart or download access. for that datastream. An organization can give its members a higher level than the public, so logging in as a member can unlock more.
The Reduced Set
Section titled “The Reduced Set”For a datastream you can only chart, Dendra splits your date range into short time intervals. For each interval it keeps four values that were actually recorded: the first, the last, the lowest, and the highest. These are real readings, not averages or smoothed values, so peaks and dips stay visible.
- A longer date range uses longer intervals. A shorter range shows finer detail, but never every reading.
- Fields drawn this way are marked with an asterisk (
*) in the chart legend, with a note beneath it. Export CSVsaves what the chart drew. For a*field, the CSV has the reduced set, not every reading.
Chart Colors
Section titled “Chart Colors”Each field in the cart gets a default line color on the Chart page. Colors come from the Okabe-Ito palette, a set designed to stay distinguishable for people with common kinds of color blindness.
The default depends on the measurement, so the same kind of data looks the same from chart to chart.
| Color | Hex | Typically used for |
|---|---|---|
| Vermillion | #D55E00 | Temperatures: air, soil, water, dew point, wind chill |
| Yellow | #F0E442 | Radiation and light |
| Bluish green | #009E73 | Rain and other precipitation, plant water, green pigments |
| Blue | #0072B2 | Open water: stream stage, discharge, water level, snow depth |
| Reddish purple | #CC79A7 | Humidity and water chemistry |
| Orange | #E69F00 | Water in soil and other substrate, such as soil moisture |
| Black | #000000 | Pressure, wind, carbon dioxide, lightning, and logger or instrument status (battery, signal) |
Some things to know:
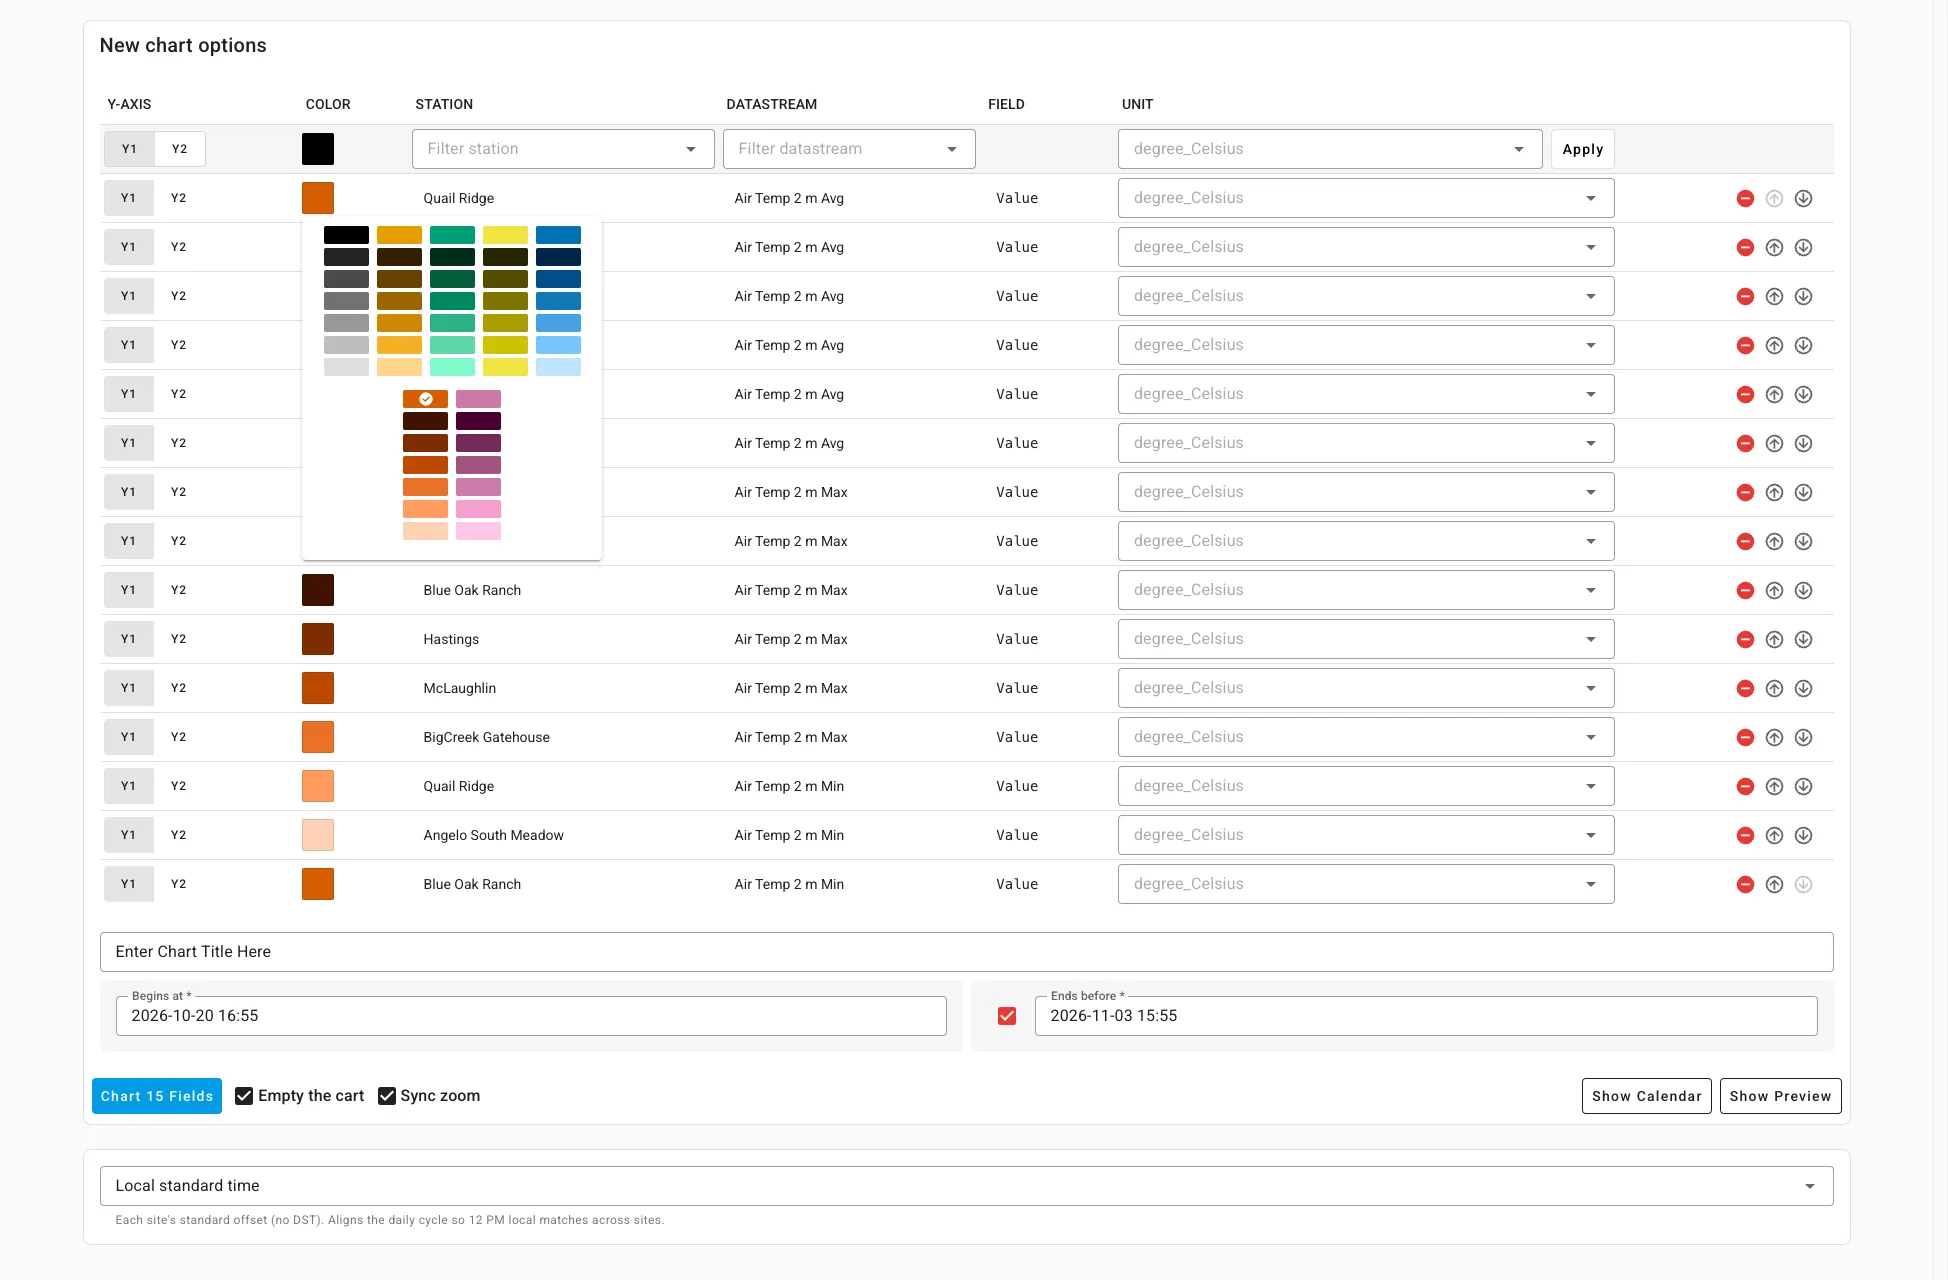
- More than one of a color. When the cart already has a line in that color, the next one takes a different shade of the same color, darker shades first and then lighter ones. Two air temperature lines both stay in the vermillion family. After all the shades are used, the colors repeat.
- No color for the measurement. A datastream with no measurement, or with
Unknown, takes the next unused color from the palette. - You choose. In the cart table on the Chart page, click the color to pick any swatch. Each column of swatches is one color family.
- Sky blue and grey are left out. Sky blue is too close to the blue shades, and grey overlaps the black ones.
Why These Colors
Section titled “Why These Colors”No standard assigns one line color to each environmental variable, so the defaults follow published guidance where it exists:
- Rain uses green, and pressure and wind use black, following the American Meteorological Society (AMS) guidelines for color in meteorological graphics and the World Meteorological Organization (WMO) station model.
- Open water uses blue, following U.S. Geological Survey (USGS) illustration standards.
- Temperature uses vermillion, the warm red in the palette. AMS paints temperature contours tan, which is not in this palette.
- Air temperature and relative humidity use different colors, so the usual weather pair is easy to tell apart.
A Note on Locations
Section titled “A Note on Locations”Some sites are sensitive, such as those with rare species. For these, the public map may show a location that is slightly off from the true one. If you are logged in and a member of the organization, the map uses the exact location for that organization’s sites. Other organizations still show the public location. The same map can show both.
Feedback
Section titled “Feedback”This is a new feature and we want to hear how it works for you. When you are logged in, choose Feedback in the top bar.
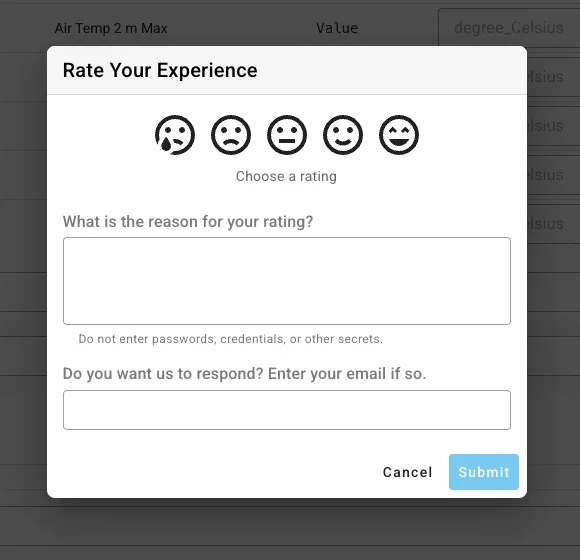
- Choose a rating from very unhappy to very happy.
- Tell us why. Please do not enter passwords or other secrets.
- Enter your email if you would like a response.
- Hit
Submit.
If you are not logged in, you can reach us from the support page.